
Insulin Resistance Is a Stronger Risk Factor of Cardiovascular Disease Than LDL-C and ApoB
Introduction
Identifying and optimizing risk factors associated with cardiovascular disease are important priorities for health-conscious individuals and healthcare professionals. For decades, it has been recognized that elevated levels of low-density lipoprotein (LDL), Apolipoprotein B (ApoB), high blood pressure (hypertension), and obesity are causal risk factors of cardiovascular disease. The importance of optimizing these risk factors through dietary, lifestyle, and +/- prescription medications cannot be overstated.
Meanwhile, emerging evidence suggests that insulin resistance is a stronger risk factor for the development of cardiovascular disease than elevated levels of LDL, ApoB, blood pressure, and obesity.1 In fact, insulin resistance appears to be a significantly more influential risk factor in the development of atherosclerosis than the traditional risk factors previously mentioned. This includes premature cardiovascular disease in adults less than 55 years of age, as well as cardiovascular disease at all ages.
Notably, Hemoglobin A1c (HbA1c) does not adequately capture the potential risk of cardiovascular disease attributed to insulin resistance. Specifically, HbA1c is primarily a measure of long-term blood glucose control. Therefore, some individuals with early stages of insulin resistance can still maintain normal blood glucose control, and thus, a normal HbA1c. The same limitations apply to continuous glucose monitoring and fasting blood glucose, which are measurements of short-term blood glucose control, rather than insulin resistance. The earliest manifestations of insulin resistance are characterized by elevated levels of insulin (hyperinsulinemia), which is a compensatory mechanism that allows the body to maintain normal levels of blood glucose during early stages of insulin resistance. In later stages of insulin resistance, blood glucose dysregulation can occur, resulting in abnormalities of HbA1c, continuous glucose monitoring, and fasting blood glucose. In summary, these traditional measurements of insulin resistance are effective at identifying later stages of insulin resistance, but often miss early stage insulin resistance.
Recently, the Lipoprotein Insulin Resistance Score (LPIR) has emerged as a valuable tool to identify and quantify insulin resistance. Specifically, the LPIR Score has a unique ability to identify very early stages of insulin resistance, including those with normal blood glucose, normal HbA1c, and those with a normal body weight. Briefly, the LPIR Score utilizes NMR technology to measure lipoprotein abnormalities observed in insulin resistance, which is then reported as an LPIR Score from 0 (most insulin sensitive) to 100 (most insulin resistant). The clinical relevance of the LPIR Score has been demonstrated in large-scale prospective cohort studies, with evidence suggesting that it is one of the strongest predictive biomarkers of cardiovascular disease and future Type 2 Diabetes.1-4 Meanwhile, the LPIR Score can be obtained with a single fasting blood sample and it is relatively affordable.
The intention of this post is to review evidence comparing the relative risk of numerous cardiovascular risk factors, the available tools to measure and quantify insulin resistance, and the associated strengths, limitations, and weaknesses of these diagnostic tests.
Related Podcast Episode
Disclaimer
This content is for general educational purposes only and does not represent medical advice or the practice of medicine. Furthermore, no patient relationship is formed. Please discuss with your healthcare provider before making any dietary, lifestyle, or medication changes. I have no financial conflicts of interest to report or affiliations with any diagnostic testing companies mentioned in this post.
Notify Me of New Content
Provide your email address to receive notifications of new blog posts and podcast episodes.
Content Summary
Risk Factors of Cardiovascular Disease
For decades, it has been recognized that LDL, ApoB, hypertension, and obesity are causal risk factors of cardiovascular disease. Furthermore, the improvement of these risk factors through dietary, lifestyle, and pharmacotherapy interventions have resulted in reduced rates of cardiovascular disease and should be recognized as major accomplishments within the field of public health. The importance of optimizing these risk factors cannot be overstated, and the content of this post is not intended to downplay or mitigate the significance of these modifiable risk factors.
Meanwhile, there is emerging evidence to suggest that insulin resistance is a stronger predictor of cardiovascular disease than the traditional risk factors mentioned, including elevated levels of LDL, ApoB, Lipoprotein-A, blood pressure, obesity, tobacco use, and a family history of cardiovascular disease (Table 1).1 The overwhelming majority of research has focused on lipoproteins and hypertension. While it is recognized that insulin resistance also contributes to cardiovascular disease, there are very few studies comparing the relative impact of metabolic abnormalities such as insulin resistance compared to the traditional cardiovascular risk factors.
In 2021, researchers from Mayo Clinic and Harvard Medical School published results from the Women’s Health Study investigating more than 50 risk factors and the incidence of cardiovascular disease at various ages of life.1 Specifically, this was a prospective cohort study of more than 28,000 US female health professionals, with follow-up spanning an average of 21.4 years. Participants did not have a known diagnosis of cardiovascular disease at the time of study enrollment. The study authors acknowledged that there have been no large prospective studies investigating the association of such a wide variety of traditional and metabolic risk factors regarding cardiovascular disease, highlighting the unique importance of this study.
While some readers of this post may question the relevance of a female-only cohort, there are two important points to acknowledge. (1) Women experience lower rates of cardiovascular disease than men.6 (2) Women typically develop cardiovascular disease later in life than men.7 Therefore, the identification of risk factors contributing to premature cardiovascular disease in women is likely to provide meaningful insight to adult men and women alike.
Results of the Women’s Health Study
Among more than 50 biomarkers examined including lipid, inflammatory, and metabolic biomarkers, the LPIR Score was associated with the highest relative risk of cardiovascular disease in all age groups (Table 1). Specifically, the LPIR Score represented a stronger predictive risk of cardiovascular disease than all other measurements of lipoproteins, inflammation, blood pressure, and body mass index, per standard deviation increment. Compared with the LPIR score, the Hemoglobin A1c level was weakly associated with incident cardiovascular disease, highlighting the distinct utility of each measurement (Table 2).
Table 1. Risk Factors of Cardiovascular Disease in the Women’s Health Study
| Risk Factor, per SD Increment | Age of Onset < 55 Years Adjusted Hazard Ratio | Age of Onset 65 – 75 Years Adjusted Hazard Ratio |
|---|---|---|
| Insulin Resistance, LPIR Score | 6.40 | 2.09 |
| Systolic Blood Pressure | 2.24 | 1.48 |
| Triglycerides | 2.14 | 1.61 |
| Apolipoprotein B (ApoB) | 1.89 | 1.52 |
| C-Reactive Protein (CRP) | 1.76 | 1.62 |
| Non-HDL Cholesterol | 1.67 | 1.41 |
| Body Mass Index (BMI) | 1.47 | 1.33 |
| LDL Cholesterol | 1.38 | 1.24 |
| Hemoglobin A1c | 1.38 | 1.24 |
| Lipoprotein(a) | 1.22 | 1.11 |
Table 2. Median and Interquartile Ranges of Baseline Biomarker Levels
| ASCVD Before Age 55 | ASCVD Ages 55 – 65 | ASCVD Ages 65 – 75 | ASCVD Ages 75+ | No Development of ASCVD | |
|---|---|---|---|---|---|
| LPIR Score (0–100) | 65 (43 – 79) | 58 (35 – 74) | 55 (35 – 72) | 49 (28 – 68) | 39 (20 – 60) |
| Hemoglobin A1c, % | 5.1 (4.9 – 5.4) | 5.1 (4.9 – 5.6) | 5.1 (4.9 – 5.3) | 5.1 (4.9 – 5.3) | 5.0 (4.8 – 5.2) |
In addition to biomarkers, several disease-states were also investigated. Among all disease-states analyzed, Diabetes was the strongest risk factor for the development of premature cardiovascular disease, and cardiovascular disease at any age. The next strongest risk factor was Metabolic Syndrome, which is an associated disease-state of insulin resistance and diabetes. Both Diabetes and Metabolic syndrome were stronger risk factors for the development of cardiovascular disease than Hypertension or Obesity (Table 3).
Table 3. Associations of Risk Factors of Cardiovascular Disease by Age at Onset
| ASCVD Before Age 55 Adjusted Hazard Ratio | ASCVD Before Ages 65 – 75 Adjusted Hazard Ratio | |
| Diabetes | 10.71 | 3.47 |
| Metabolic Syndrome | 6.09 | 1.79 |
| Hypertension | 4.58 | 1.64 |
| Obesity, BMI > 30 kg/m2 | 4.33 | 1.32 |
Understanding Insulin Resistance
Insulin resistance is the process in which the liver, muscle, and adipose tissue (body fat) become less sensitive to the effects of insulin. In response to insulin resistance, the body compensates by increasing the amount of insulin released from the pancreas, which results in persistently elevated levels of insulin (hyperinsulinemia). Importantly, insulin resistance contributes to metabolic dysfunction and a cluster of abnormalities with potentially serious health consequences, including cardiovascular disease and other disease associated with Metabolic Syndrome (Table 4). Hyperinsulinemia contributes to blood vessel injury and inflammation throughout the body, including arterial wall thickening, reduced arterial compliance, endothelial injury, and dysfunction, all of which contribute to the development of atherosclerosis and cardiovascular disease. Notably, the negative health impacts of insulin resistance can occur in individuals with a normal body weight and normal blood glucose.
If insulin resistance worsens, this can result in a pathological state known as Type 2 Diabetes (T2DM). Prior to the development of Type 2 Diabetes, however, individuals pass through two transitional stages. (1) A state of insulin resistance and normal blood glucose control, followed by (2) insulin resistance with impaired blood glucose control (hyperglycemia). Therefore, it is possible that measurements of blood glucose control, such as Hemoglobin A1c (HbA1c), continuous glucose monitoring (CGM), and fasting blood glucose will fail to identify individuals with early stages of insulin resistance (Figure 1).
Figure 1. Stages of Insulin Resistance
Acronyms: Hemoglobin A1c (HbA1c), Continuous Glucose Monitor (CGM). Note: Lower levels of insulin levels can be observed in late stages of insulin resistance as a result of pancreatic β-cell dysfunction.
Measuring Insulin Resistance
Several laboratory tests are available to measure insulin resistance. The most accurate tests include the hyperinsulinemic-euglycemic clamp, insulin suppression test, and the glucose tolerance test, all of which require intravenous infusions and multiple blood samples. As a result, these tests are used almost exclusively in clinical research settings and are not practical for everyday individuals.
Alternatively, a fasting insulin level can be used in conjunction with a fasting glucose in the homeostasis model assessment of insulin resistance (HOMA-IR), a validated mathematical model of insulin resistance. Limitations of HOMA-IR include substantial day-to-day variations of fasting insulin levels, which will have profound impact on HOMA-IR results. The same limitation applies to fasting glucose. Furthermore, HOMA-IR correlates strongly with Body Mass Index (BMI), demonstrating the lack of sensitivity in detecting early stages of insulin resistance among those with a normal body weight.2
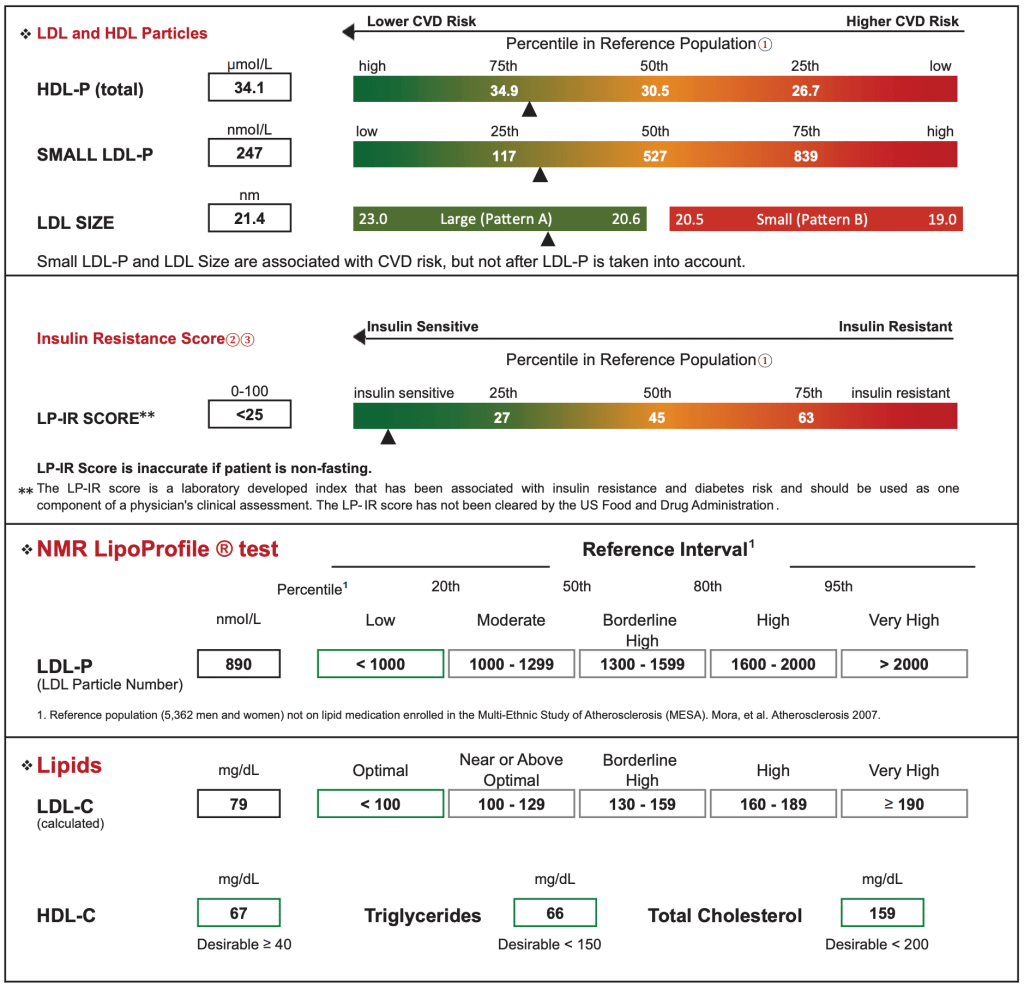
Meanwhile, abnormalities in lipoprotein metabolism are observed many years before the onset of blood glucose dysregulation (hyperglycemia). Specifically, insulin resistance contributes to characteristic abnormalities of lipoprotein particle sizes and concentrations, including higher levels of the large very-low-density lipoprotein particles (VLDL-P), small LDL particles (LDL-P), and lower levels of large high density lipoprotein particles (HDL-P).5 By using NMR technology of fasting venous blood samples, a weighted score of six lipoprotein measurements can be combined into a single mathematical algorithm ranging from 0 (most insulin sensitive) to 100 (most insulin resistant), which is reported as an LPIR Score. In addition to being a useful tool for quantifying and detecting insulin resistance, the LPIR Score has been shown to predict future incidence of Type 2 Diabetes, even when controlled for measurements of insulin, lipoproteins, and HOMA-IR.2-4 Importantly, the LPIR Score remains relevant even among individuals prescribed statin therapy.8 Specifically, statins have a relatively small effect on the lipoprotein parameters that are heavily weighted in the LP-IR algorithm.5
Figure 2. NMR LipoProfile Test Sample Report by Labcorp
Insulin Resistance and Non-Cardiovascular Disease
While insulin resistance is a potent risk factor of cardiovascular disease, insulin resistance also contributes to many non-cardiovascular diseases including dementia and cancer (Table 4). Analysis of the Mayo Clinic Alzheimer’s Disease Patient Registry revealed that more than 80% of patients with Alzheimer’s dementia had type 2 diabetes or an impaired fasting glucose level, for which insulin resistance is increasingly recognized as a contributing risk factor of cognitive impairment.9,10 Meanwhile, a growing body of evidence implicates insulin resistance as a significant risk factor for certain cancers. Insulin itself is a growth hormone that appears to activate various cellular pathways that promote cellular division and risk of tumor development.11 This is particularly relevant in younger adults, for which cancer, not cardiovascular disease, is the leading cause of death in adults ages 45-65 years. Furthermore, the incidence of cancer is increasing among young adults, and presenting at more advanced and later stages.12 Unlike cardiovascular disease, many of these cancers have no routine or recommended screening modalities. Therefore, cancer is often identified as a result of symptoms in the setting of advanced or metastatic disease, where the goals of treatment are often not curative, but rather, to prolong life as long as possible.
Table 4. Diseases Associated with Insulin Resistance and Metabolic Syndrome
| Cardiovascular Disease and Stroke | 10+ Cancers and Inflammation |
| Other Diseases of Atherosclerosis | Infertility, Low Testosterone, PCOS |
| Dementia and Vascular Dementia | Pre-Eclampsia and Pregnancy Los |
| Kidney Disease and Liver Disease | Infection, Heartburn, Arthritis, Gout |
Table 5. Cancers Associated with Insulin Resistance and Obesity13
| Esophageal Cancer | Kidney Cancer | Uterus Cancer |
| Stomach Cancer | Liver Cancer | Ovarian Cancer |
| Pancreatic Cancer | Colon and Rectum Cancer | Multiple Myeloma (Bone Marrow) |
| Gallbladder Cancer | Thyroid Cancer | Brain Cancer (Meningioma) |
Food, Nutrition, and Insulin Resistance
Disclaimer About Food and Nutrition
The discussion of food, nutrition, and human health is a remarkably controversial subject. The following commentary is intended to be a discussion of the biochemical impact of various dietary interventions on health outcomes, specifically, the LPIR Score, for which there is limited data. The evidence presented will be exclusively from high-quality, randomized controlled trials, published in reputable medical journals. Importantly, the following commentary is NOT intended to advocate for any specific dietary pattern, nor is it a comprehensive discussion of food, nutrition, and human health. The relationship of food, nutrition, and lipoproteins (e.g. LDL, ApoB) is not discussed here. If there are additional dietary studies relevant to the LPIR Score and insulin resistance that were not addressed, please message me or comment below. Finally, the scientific method benefits those who maintain an open mind with the possibility to consider that their currently held belief(s) can be better-informed with a broader array of scientific evidence. My highest priority is to use scientific evidence to better understand and explain the scientific truth pertaining to food, nutrition, and human health. I have no agenda or financial conflicts of interests to disclose.
Targeted Dietary Strategies to Improve Insulin Resistance are Distinct from Targeted Strategies to Lower LDL-C and ApoB
Due to the causal association of LDL-C, ApoB, and cardiovascular disease, a priority among health-conscious individuals is to reduce or limit the consumption of saturated fat. Importantly, however, the reduction of saturated fat does not meaningfully impact or improve measurements of insulin resistance.14,15 Therefore, it is reasonable to simultaneously consider additional dietary strategies for the sake of optimizing insulin resistance, which encompasses a distinct biochemical pathway than that of elevated levels of ApoB-containing lipoproteins.16
Many trials have evaluated the effect of dietary macronutrient intake on insulin resistance measured by fasting blood glucose, Hemoglobin A1c, and HOMA-IR. When compared to a standard control diet, most dietary interventions achieve improvements in these biomarkers, including a low-fat diet, low-carbohydrate diet, Mediterranean diet, and other dietary variations.17-19 In other words, there are many successful dietary approaches to improving biomarkers of glycemic control (e.g. blood glucose, Hemoglobin A1c, and HOMA-IR).
More intriguing is the experimental evidence suggesting that insulin resistance, as well as other biomarkers of metabolic health, can be improved with dietary restriction of refined sugars alone, namely sucrose and high-fructose corn syrup, independent of caloric intake and carbohydrate intake.20,21 In other words, improvements in insulin resistance can be achieved without caloric or carbohydrate restriction, but instead, with improvement in the quality of calories and carbohydrates consumed. While there is controversy and debate regarding the safety and efficacy of low-carbohydrate diets, the restriction of highly processed carbohydrates, namely added and refined sugars, is a relatively non-controversial and evidence based strategy for improving insulin resistance and metabolic health.
Dietary Strategies to Improve Insulin Resistance and the LPIR Score
Beyond dietary trials investigating the impact on blood glucose control, there are very few investigating the LPIR score as a primary outcome. In 2022, researchers at Boston Children’s Hospital and Harvard Medical School evaluated the impact of diets varying in carbohydrate and saturated fat on LPIR Score and other cardiovascular risk factors.22 The clinical trial enrolled 164 participants who were randomly assigned to three diets spanning a 20-week period. The prepared diets contained a fixed amount of protein (20% of daily calories) and differed in the ratio of Carbohydrate:Saturated-Fat (Low-Carb: 20% Carbohydrate – 21% Saturated Fat; Moderate-Carb: 40% Carb – 14% Sat Fat; High-Carb: 60% Carb – 7% Sat Fat). Results of the study demonstrated beneficial improvements in the LPIR Score in a dose-dependent fashion favoring carbohydrate restriction (Table 6).
Table 6: Dietary Impact of Carbohydrate and Saturated Fat on LPIR Score
| Low Carbohydrate (20% Carb, 21% Sat Fat) | Moderate Carbohydrate (40% Carb, 14% Sat Fat) | High Carbohydrate (60% Carb, 7% Sat Fat) | |
| LPIR Score, Insulin Resistance | – 5.3 | – 0.02 | + 3.6 |
Despite variations in the amount of saturated fat consumed in each diet, LDL cholesterol, LDL-P, and inflammatory markers did not differ by diet, which highlights the variable impact of saturated fat on changes on lipoprotein measurements. As the study authors acknowledged, many dietary studies evaluating saturated fat intake demonstrate increased levels of LDL/ApoB, however, this finding is not always demonstrated experimentally.23 The inconsistent effect of saturated fat on lipoproteins is likely attributed to the differing types and quality of saturated fat consumed in various dietary trials. In other words, not all saturated fat impacts levels of lipoproteins equally. This is similar to the concept previously discussed regarding the quality of carbohydrates, where 100 calories of high-fructose corn syrup does not affect insulin resistance the same as 100 calories of potatoes.
Separately, while Lipoprotein(a) is often regarded as a biomarker and lipoprotein that is genetically determined, the Low-Carbohydrate diet achieved a 14.7% reduction in Lipoprotein(a) (Table 7).
Table 7. Dietary Impact of Carbohydrate and Saturated Fat on Lipoprotein(a)
| Low Carbohydrate (20% Carb, 21% Sat Fat) | Moderate Carbohydrate (40% Carb, 14% Sat Fat) | High Carbohydrate (60% Carb, 7% Sat Fat) | |
| Lipoprotein(a) | – 14.7% | – 2.1% | + 0.2% |
With regard to the LPIR Score, it is reasonable to conclude that health conscious individuals would derive additional health benefits from the targeted restriction of highly processed carbohydrates, including added and refined sugars, high fructose corn syrup, and other highly refined carbohydrates. To offset such carbohydrate restriction, a selective preference of whole grains is one effective strategy, while the incorporation of high quality dietary fats from naturally occurring sources is another effective strategy. The evidence to support this latter claim was most profoundly demonstrated in the PREDIMED study, which demonstrated a reduction in cardiovascular incidence and mortality by incorporating an increased consumption of dietary fat (and total calories) from mixed nuts and olive oil.24 Notably, these cardiovascular benefits were achieved without a reduction in saturated fat. Meanwhile, the restriction of highly processed carbohydrates and saturated fat are not mutually exclusive principles. In other words, individuals with elevated levels of LDL-C and/or ApoB can simultaneously restrict the consumption of saturated fat while avoiding highly refined carbohydrates.
Beneficial Impact of Aerobic Exercise and Strength Training on LPIR Score
Several studies have demonstrated meaningful improvement of the LPIR Score with aerobic exercise and weight resistance training.25,26 Unsurprisingly, greater duration and higher intensity of aerobic exercise results in greater improvements of LPIR. The beneficial effects of aerobic exercise on LPIR Score are greater than weight resistance training alone, however, the greatest benefit was achieved with the combination of both aerobic exercise and weight resistance training.25 The combination of aerobic exercise, weight resistance training, and dietary modification, have been show to result in the greatest overall benefit in LPIR Score.


Thank you so much for diligently organizing what is normally presented as opposing or at least paradoxical (and therefore neutralizing) explanations of causes and associations of the problems of metabolic and systemic health and the resulting (exhausting) strategies of competing diets.
We have been waiting for someone to emerge who will get above the fray to make sense of it … embracing the apparent contradictions by explaining the here-to-fore irreconcilable etiology. You are helping me, the patient, out of the swamp of dietary wars, and the monochromatic thinking of cardiologists, (big-pharma-shaped) general practitioners, and click-baiting internet diet-doctors.
You address the etiology as a developmental and interactive process over time, and you also point out (carefully so as not to enter the fray) the question of what goes into the body. There is much more to this than is usually given credit: the “definitions/distinctions” of the classes (ie topology) and “quality” of the foods and micronutrients in experimental study diets. We (the patients) are the dogs wagged by the tail of the downstream, operationalized findings of imprecise experiments and meta-analyses (many in peer-reviewed and prestigious journals) driving the thinking and hands (advice, prescription signatures) of our doctors and the supplement market.
Methinks folks should not be inundated with an attention-seeking singular-focus approach of landing on the biochemical panacea or hanging the hat on a dominant metabolic principle (or worse, the ultimate supplement or ultimate food) none of which can stand alone in explaining metabolic health (or the lack of it). For example, keto (i.e. low carb) adherents obsess about all carbs being “sugars” (conflated with processed, concentrated fructose); whether from a refined or natural source and regardless of nutrient and food combinations and abundances. Anti-leptin thinking and fat-promoting adherents absurdly dismiss real (ie organic, unrefined, unadulterated) whole grains, and also ignore fiber, resistant starches, and the net carb realities of 10,000 years of glucose metabolism in people who were never overweight nor suffered fatty-liver.
As you hint (carefully) there is no history of mankind being strictly carnivore; vegetables, fruits, grains, pulses, potatoes, and rice were always (successfully) the historical core of healthy diets. We need to stop confusing the “modern” industrial, agri-pharma and food processing food-supply of today with the food-supply of yesterday. On top of which it seems that metabolic health, dietary research, and their incumbent advice are largely devoid of the consideration of the variations in the order of food ingestion, combinations/interactions, and the end-to-end (no pun intended) GI digestive cycle. There is an almost negligent over-generalization and absence of standardization, regarding food quality (source, treatment, physical-chemical form, accompanying ingredients, molecular recombinations, and structural processing) and its digestion-driven, metabolic implications.
I think you may be among the few who are forcing the community onto the path of a “unified field theory” of metabolic health. It’s high time.
This isn’t my blog, but the owner has encouraged community to converse with a Reply button, so I’m doing so. I hope helpfully. I’ll rely on the Moderator to scrub this if it’s considered unhelpful.
Tedd, you’ve contributed a well-reasoned erudite post. Thank you. I’d like to respectfully suggest a nuance to your argument.
“There is no history of mankind being strictly carnivore”: actually, there’s plenty, continuing to the present. Humans are adaptive, have certainly lived (mostly) well on a wide range of diets. Grains in the Middle East, rice in Eurasia, fish & fruit in Polynesia, meat & animal fat in the far north. That doesn’t mean there isn’t fall-out for some people: most of European extraction appear to be largely adapted to a carb-rich diet, but a sizeable percentage have ALWAYS succumbed to Type 2 Diabetes (T2D), Heart Disease (HD), cancers & dementias (incl. senility) – all documented in the most ancient records. Many (all?) of these ills appear to be diet-induced.
“Vegetables, fruits, grains, pulses, potatoes, and rice were always (successfully) the historical core of healthy diets.” – Respectfully, no. Continuing the point made above, consider extreme variations: northern indigenous peoples (the Inuit of Canada, Greenland, Scandinavia & Siberia) lived for many thousands of years on an entirely meat & fat diet: fish, whales, seal & caribou, depending on the season. There are NO carbs in the north: none, nada, zilch. Berries for a few weeks each year, but you have to fight bears for them, and there aren’t many carbs in berries. There isn’t even honey, which is pretty much the only carb content you’d find in the diets of indigenous tribes farther south, until you reach very temperate or tropical climes.
Re. Carbs being “the historical core of healthy diets”: nope. The Inuit were very healthy; peoples farther south much less so. Carb-rich diets are convenient, cheap, facilitate storage & distribution for large populations: you can build an empire, civilizations on them. But they’re not especially healthy: all the diseases mentioned above are documented as “normal” throughout time. In the north OTOH, NONE of these diseases was known. That’s well-documented by observers trained & equipped to have spotted them. Until the arrival in 1908 of American whalers, who brought tea, flour & sugar. Tea’s fine; flour & sugar really messed them up. Within a couple of years all the diseases mentioned above were becoming common.
Why so fast? You put your finger on it: “realities of 10,000 years of glucose metabolism in people who were never overweight nor suffered fatty-liver.” Anyone whose ancestry goes back to the Middle East/fertile crescent or Eurasia, has developed partial adaptation to carbs in the diet. Not complete: there were in fact overweight people (though nothing like the incidence of today) and many probably suffered fatty-liver. T2D, cancers, HD, dementias: they’re all there in the historical records. Not so much in the north. So “10,000 years” of adaptation since the invention of agriculture certainly HAS produced partial adaptation. Not complete, or we wouldn’t have a history of “normal” diseases listed above. But enough to sustain large populations.
If the bulk of humanity has partial adaptation, what about indigenous cultures? None appears to have had substantial carb content in their diets. Even in southern climes, hunter-gatherers (Amazonian tribes, the San bushmen of Botswana, Namibia, Angola, Zambia, S Africa, the aborigines of Canada, Australia, the Māori of New Zealand) had diets that universally featured near-zero carb content. They were healthy, strong & robust – until exposure to western diets. In all these peoples we now observe near-universal T2D & dementias, heightened prevalence of HD, cancers. Also near-universal & immediate susceptibility to addiction: if you can’t digest grains, you can’t digest grain-alcohols. Getting drunk on one beer, staying drunk for hours: that’s not learned behavior or socialization, that’s carb intolerance. Lack of genes or enzymes to break down an otherwise toxic substance.
You said “We need to stop confusing the “modern” industrial, agri-pharma and food processing food-supply of today with the food-supply of yesterday.” – ABSOLUTELY; agreed. Carbs we ate in the past – with utility but not impunity – are not the carbs of today. ALL modern grains, vegetables & fruits are genetically-modified through selective breeding for size, sugar content, stability. Our oranges, apples, even grains look little like their progenitors from even 150 years ago. They’re huge, generally much sweeter. Our processed foods are made toxic with reliance on grain oils. And sugar is near-ubiquitous. Sugar – apart from honey – was almost unknown through most of human history. Until the 18th century, when we used slave labor to mass-produce it. Since then it’s been a staple, and a primary driver of ill health.
Can YOU live on a carb-rich diet? Go for it. Many can. I can’t; pretending otherwise is obtuse.
Because YOU can, all humans can? Please.
Western medicine believes what it sees as prevalent is “normal”. Not for humans throughout time it isn’t. It ought not to be seen as normal: it doesn’t have to be.
I hope my comments were helpful. If the moderator permits it, I’ll enjoy (hopefully benefit from) responses from you or others.
Dr. Forey’s blog content is unusually well-researched, well-reasoned.
I’m grateful to be learning from it, & from other readers like you, Tedd. Thanks.
– James
Thank you for teaching on this. Very helpful! Saw this from Dr. Annette Bosworth utube. Keep teaching and most importantly, keep helping your patients regain their health-that success speaks louder than words!
Saw this from Dr. Annette Bosworth utube. Good job.
I believe i fit into the LMHR category for what i believe to be the last 10 years. I had an LPIR test done in 2017. My insuline sensitivity score was <25. My interest at the time was to see if my high LDL-C and high Apo-B particule numbers were mostly pattern A (healthy) LDL or pattern B (small dense, unhealthy) LDL. My 2017 test revealed that it was pattern A, as my <25 score would indicate. My question would be, is the high predictive value of a high LPIR score derived from it's ability to estimate the smaller, denser, and i would guess, more atherogenic particules of pattern B LDL? If so, why would any discussion of LDL being a CVD risk factor not include the distinction between healthy and unhealthy LDL?
Thank you for your comment. This is a good question. You are correct in acknowledging that LDL particle size and density is an important variable regarding risk of ASCVD. I take this into account regarding the care of my patients in my own clinical practice. Truthfully, these articles take a lot of effort to put together, and I have to draw the line somewhere with regard to what content is and is not included. I agree with you that this is an important and worthwhile conversation/subject. It is deserving of its own blog post and I look forward to addressing it in the future. Meanwhile, the primary intention of this article was to acknowledge the concept of the LPIR Score which is remarkably unknown and under-appreciated. If your read the research paper by Dugani in JAMA, they do compare the association of ASCVD with regard to particle size. It is interesting to review these numbers, which agree with your perspective. Wishing you well. Thank you for the comment.
Thank you and much appreciation for the detailed article which helps a lot to understand the subject.
Thank you for your kind words. I am glad to hear that you enjoyed the article.
* Error alert: You’ve duplicated a reference: #9 & 10 are identical. Probably not what you wanted. Was reference #10 missed?
Good blog post, great content well-written.
Thank you Dr. Forey.
Thank you for the kind words and thank you for bringing this to my attention. I have corrected the references. Please let me know if you observe further errors. Thank you.
Hey Kev,
Awesome breakdown. I have not been enlightened as to importance of LPIR score until now, despite being in my now 9th year of medical training. Fascinating data. As an interested reader maybe a blog post or podcast episode delving deeper into the apoB/LDL pathway mediated atherosclerosis vs that mediated by insulin resistance in the future?!
I just listened to this podcast yesterday and reviewed the charts today. Thank you for taking the time to present the info in such an organized and easy-to-understand way. The actionable steps are helpful!
Thank you for explaining LPIR. I just had bloodwork done and that showed up on my results. I had no idea what it was or what it meant since I have a low A1C and always thought that was what I should worry about. But this blog post really opened my eyes and now I feel like I have some solid information that I can work with to improve my health. There is so much out there and to have it explained so clearly is greatly appreciated.