Why LDL-C, Hemoglobin A1c, and Continuous Glucose Monitors Are Not Optimal Tests For Longevity
Introduction
Several tests that are commonly utilized for longevity and the prevention of illness include LDL cholesterol (LDL-C), Hemoglobin A1c (HbA1c), and Continuous Glucose Monitors (CGMs). These tests provide useful information regarding the risk of cardiovascular disease and blood glucose control. However, with advancements in technology, there are now multiple laboratory tests that provide more accurate and useful information than LDL-C, HbA1c, or CGMs. Despite these improvements in testing, widespread awareness and adoption of these superior tests remain limited. The purpose of this article is to demonstrate the shortcomings of LDL-C, HbA1c, and CGMs. By examining alternative testing strategies, this article seeks to empower health conscious individuals and healthcare professionals in their ability to adopt more effective testing strategies for the prevention of disease and promotion of longevity.
In this article, the effectiveness of LDL-C will be compared to other more sensitive measurements of cardiovascular disease risk, including Apolipoprotein B (ApoB). This article will also examine practical examples where LDL-C can produce misleading test results not always reflective of true cardiovascular risk. While LDL-C and ApoB have garnered the greatest amount of attention regarding cardiovascular disease prevention, we will review the evidence demonstrating that insulin resistance is a stronger risk factor of cardiovascular disease than LDL-C and ApoB. Meanwhile, many utilize Hemoglobin A1c as a tool for detecting the risk of insulin resistance. However, HbA1c is a measurement of long-term blood glucose control and is not particularly sensitive in its ability to detect insulin resistance. Notably, insulin resistance can exist in the presence of a normal HbA1c and CGM data. Additionally, insulin resistance can occur in those with normal blood glucose control and a normal body weight. Therefore, we will investigate superior testing strategies used to identify early stages of insulin resistance, including the Lipoprotein Insulin Resistance (LPIR) Score and Triglyceride-Glucose Index (TyG Index). This article will also discuss the strengths and limitations of the Homeostasis Model Assessment of Insulin Resistance (HOMA-IR).
In summary, this article seeks to demonstrate that a normal LDL-C does not rule out the risk of cardiovascular disease, and that normal results from HbA1c and CGM data do not rule out the possibility of insulin resistance. Meanwhile, there are more effective testing strategies available to those who are seeking to optimize their health, likelihood of longevity, and ability to identify disease risk as early as possible.
Related Podcast Episode
Disclaimer
This content is for general educational purposes only and does not represent medical advice or the practice of medicine. Furthermore, no patient relationship is formed. Please discuss with your physician before making any dietary, lifestyle, or medication changes. Additionally, I have no financial conflicts of interest or affiliations with any diagnostic testing or pharmaceutical companies mentioned.
Notify Me of New Content
Provide your email address to receive notifications of new blog posts and podcast episodes.
Content Summary
Part 1. Shortcomings of LDL-C
There Are Stronger Predictors of Cardiovascular Disease Than LDL-C
Atherosclerosis is a leading cause of cardiovascular diseases, including heart attack, stroke, and cardiac valve dysfunction. Atherosclerosis develops as a response to injury and inflammation in the arteries throughout the body, resulting in the formation of atherosclerotic plaque that can rupture, provoke blood clot formation, and obstruct blood flow to important organs like the heart and brain. Researchers have identified elevated levels of low-density lipoprotein cholesterol (LDL-C) as a risk factor of atherosclerosis, making it a central target for the prevention of cardiovascular disease.
With advancements in cardiovascular research, however, additional lipoproteins have been identified that contribute to cardiovascular disease in addition to that of LDL. To estimate the risk of these additional atherosclerotic particles, Non-HDL-Cholesterol (Non-HDL-C) was developed, which provides a more comprehensive assessment of cholesterol content in circulating atherogenic particles (Figure 1). Further advancements in medical testing now allow for the precise quantification of all atherogenic lipoproteins, reported as Apolipoprotein B (ApoB).
When comparing the predictive risk of future cardiovascular disease of LDL-C, Non-HDL-C, and ApoB, large-scale studies have repeatedly demonstrated that Non-HDL-C is a stronger predictor of cardiovascular risk than LDL-C,16-19 and ApoB is a stronger predictor of cardiovascular risk than LDL-C and Non-HDL-C (Tables 1-2).20-24
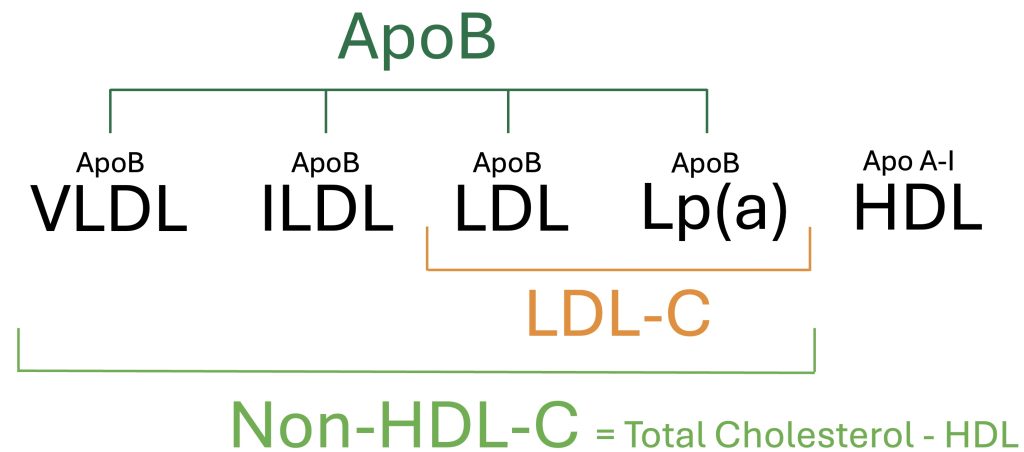
Figure 1. Overview of Circulating Lipoproteins and Associated Measurements
Apolipoprotein B (ApoB) is a direct measurement of total atherogenic particle count, based upon the quantification of the ApoB-100 surface protein attached to each atherogenic lipoprotein. LDL-C is an indirect estimate of cholesterol content in LDL particles, and Non-HDL-C is an indirect estimate of cholesterol content in all atherogenic particles.
Table 1. The Framingham Heart Study: Association of Cardiovascular Disease and Lipoproteins25
| LDL-C Hazard Ratio | Non-HDL-C Hazard Ratio | ApoB Hazard Ratio | |
| Men | 1.11 | 1.22 | 1.37 |
| Women | 1.20 | 1.28 | 1.38 |
Table 2. The Women’s Health Study: Association of Lipoproteins and Cardiovascular Disease1
| LDL-C Hazard Ratio | Non-HDL-C Hazard Ratio | ApoB Hazard Ratio | |
| Women Less Than 55 years | 1.38 | 1.67 | 1.89 |
| Women 65 to 75 years | 1.24 | 1.41 | 1.52 |

Figure 2. Strength of Association of Lipoprotein Measurements and Cardiovascular Disease
LDL-C Is Not a Reliable Marker of Cardiovascular Risk
While LDL-C is recognized as an inferior predictor of cardiovascular disease than Non-HDL-C and ApoB, changes in LDL-C can also provide misleading information. Specifically, there are instances where health improvements can result in increased levels of LDL-C despite a reduction in cardiovascular risk. This discordance represents the limitations of LDL-C as a stand-alone measurement, for which LDL-C is an indirect estimate of cholesterol content within LDL particles and may not accurately reflect changes in cardiovascular risk or atherogenic particle count. In contrast, ApoB provides a direct measurement of total atherogenic particle count, based upon the quantification of the ApoB-100 surface protein.
To demonstrate this point, Christopher Gardner, Ph.D., of Stanford University, conducted a randomized clinical trial to evaluate four dietary interventions in overweight women.26 One of the interventions was the Ornish Diet, which emphasized reducing dietary fat and saturated fat intake, a strategy aligned with health guidelines that recommend lowering saturated fat to reduce LDL-C and other cardiovascular risk factors. Another dietary intervention tested was the Carbohydrate Restricted Diet, which had previously demonstrated success in promoting weight loss and improving diabetes in other dietary studies.
In this clinical trial, known as the A to Z Trial, all dietary interventions led to meaningful health improvements when compared to participants’ baseline diets. However, the Carbohydrate Restricted Diet achieved the most significant improvements in body weight, blood pressure, and markers of insulin resistance (Table 3). Notably, the Carbohydrate Restricted Diet also resulted in a measurable increase in LDL-C. How should this be interpreted? If LDL-C is considered the primary risk factor of concern, the Carbohydrate Restricted Diet would be viewed as increasing cardiovascular disease risk despite its positive effects on other key health metrics.
Table 3. Maximal Changes in Cardiovascular Risk Factors During the A to Z Trial Spanning 12-months26
| Carbohydrate Restricted Diet | Saturated Fat Restricted Diet | |
| Body Mass Index (BMI) | – 2.16 kg/m2 | – 0.95 kg/m2 |
| Percent Body Fat (%) | – 3.6 % | – 1.5 % |
| Systolic Blood Pressure | – 7.6 mmHg | – 1.9 mmHg |
| LDL-Cholesterol | + 2.3 mg/dL | – 10 mg/dL |
| Non-HDL-Cholesterol | – 8.0 mg/dL | – 8.0 mg/dL |
| Insulin | – 3.0 µU/mL | – 1.1 µU/mL |
| Blood Glucose | – 1.8 mg/dL | – 1.4 mg/dL |
| Triglycerides | – 52.3 mg/dL | – 14.9 mg/dL |
| HOMA-IR | – 0.7 | – 0.3 |
| Triglyceride-Glucose Index | – 0.28 | – 0.08 |
Importantly, the increase in LDL-C occurred alongside a reduction in Non-HDL-C (Table 4). This divergence in the directionality of LDL-C and Non-HDL-C is known as lipoprotein discordance. As previously discussed, Non-HDL-C is a more accurate and comprehensive measure of cardiovascular risk than LDL-C alone.16-19 Therefore, despite an increase in LDL-C, the decrease in Non-HDL-C suggests an overall reduction in cardiovascular risk. Although ApoB levels were not assessed in this study, the next example will demonstrate the possibility of discordance between LDL-C and ApoB.
Table 4. Discordance of LDL-C and Non-HDL-C on Carbohydrate and Fat Restricted Diets
| Carbohydrate Restricted Diet | Saturated Fat Restricted Diet | |
| LDL-Cholesterol | + 2.3 mg/dL | – 10 mg/dL |
| Non-HDL-Cholesterol | – 8.0 mg/dL | – 8.0 mg/dL |
In a separate clinical study, patients with type 2 diabetes were treated with a Carbohydrate Restricted Diet compared to a standard control diet.27 Those following the Carbohydrate Restricted Diet experienced meaningful health improvements, including reductions in body weight, blood pressure, insulin resistance, and inflammation (Table 5). Importantly, however, LDL-C levels increased significantly, with an average rise of 21.7 mg/dL and concern for an increased risk of cardiovascular disease.
Once again, however, there was discordance between LDL-C and Apolipoprotein B (ApoB). Despite the 20 mg/dL increase in LDL-C at 12 months, ApoB levels remained unchanged (Table 5). This suggests a net neutral change in cardiovascular risk when considering ApoB, a superior marker of cardiovascular risk compared to LDL-C. Additionally, the substantial weight loss of 28 pounds, along with improvements in blood pressure and insulin resistance, likely contributed to an overall reduction in cardiovascular disease risk.
Table 5. Changes in Cardiovascular Risk Factors Among Patients with Type 2 Diabetes on Carbohydrate Restricted Diet Compared to Usual Care Control Group27
| Changes At 12-Months | |
| Body Weight | – 28 lb |
| Systolic Blood Pressure | – 6.1 mmHg |
| C-reactive protein (hs-CRP) | – 4.0 mg/dL |
| LDL-Cholesterol | + 21.7 mg/dL |
| Apolipoprotein B (ApoB) | No Change |
| Hemoglobin A1c | – 1.5 % |
| Insulin, fasting | – 17.8 µU/mL |
| Blood Glucose, fasting | – 51 mg/dL |
| Triglycerides, fasting | – 81.5 mg/dL |
| HOMA-IR | – 8.3 |
| Triglyceride-Glucose Index | – 0.46 |
Discordance of LDL-C, Non-HDL-C, and ApoB Is Not Limited to Dietary Interventions
Sodium-glucose co-transporter 2 (SGLT-2) inhibitors have recently emerged as highly effective medications for promoting weight loss, improving blood glucose control, and reducing the risk of cardiovascular disease and kidney dysfunction. Despite these benefits, clinical trials have shown that SGLT-2 inhibitors are associated with modest increases in LDL-C levels, averaging 4–6%.28-30 However, further studies have demonstrated that these LDL-C increases are not accompanied by corresponding rises in ApoB levels, highlighting discordance between these markers.31
Collectively, these examples of LDL-C and ApoB discordance demonstrate the imprecise nature of LDL-C. Again, LDL-C is an indirect estimate of cholesterol content within LDL particles.In contrast, ApoB provides a precise measurement of circulating atherogenic lipoproteins. Given this discrepancy, optimal monitoring of changes in cardiovascular risk resulting from dietary modifications, lifestyle adjustments, or medications should prioritize ApoB over LDL-C.
It is important to note that these examples are not intended to advocate for a carbohydrate-restricted diet but rather to highlight the potential for conflicting test results that may yield misleading or contradictory conclusions. By utilizing superior testing modalities like ApoB, these inconsistencies can be resolved, offering a more accurate assessment of cardiovascular risk. As demonstrated, it is difficult to confidently assess changes in cardiovascular risk by monitoring LDL-C alone. Instead, ApoB should be the preferred marker for monitoring changes in cardiovascular risk.
There Are Stronger Predictors of Cardiovascular Disease Than ApoB
While LDL-C and ApoB levels have dominated the discussion of cardiovascular disease prevention, it is not accurate to suggest that LDL-C or ApoB are the two strongest risk factors of cardiovascular disease. To demonstrate this, researchers at the Mayo Clinic and Harvard Medical School evaluated more than 28,000 female patients in the Women’s Health Study, spanning an average timeframe of 21.4 years.1 Among more than 50 risk factors evaluated, insulin resistance, measured by the Lipoprotein Insulin Resistance Score (LPIR), emerged as the strongest risk factor of cardiovascular disease across all age groups (Table 6).
Table 6. The Strength of Cardiovascular Risk Factors in the Women’s Health Study1
| Risk Factor, per SD Increment | Age of Onset < 55 Years Adjusted Hazard Ratio | Age of Onset 65 – 75 Years Adjusted Hazard Ratio |
| Insulin Resistance, LPIR Score | 6.40 | 2.09 |
| Systolic Blood Pressure | 2.24 | 1.48 |
| Triglycerides | 2.14 | 1.61 |
| Apolipoprotein B (ApoB) | 1.89 | 1.52 |
| C-Reactive Protein (CRP) | 1.76 | 1.62 |
| Non-HDL Cholesterol | 1.67 | 1.41 |
| Body Mass Index (BMI) | 1.47 | 1.33 |
| LDL Cholesterol | 1.38 | 1.24 |
| Hemoglobin A1c | 1.38 | 1.24 |
Despite being one of the strongest predictors of cardiovascular disease, many health conscious individuals and healthcare professionals are not aware of the Lipoprotein Insulin Resistance Score (LPIR). Briefly, the LPIR Score utilizes NMR technology to measure lipoprotein abnormalities associated with insulin resistance, which is then reported as a value ranging from 0 (most insulin sensitive) to 100 (most insulin resistant)(LabCorp Sample Report). Importantly, the LPIR Score has a unique ability to identify very early stages of insulin resistance, including those with a normal body weight, normal blood glucose, and normal HbA1c.3 Because the LPIR does not rely upon fasting blood glucose or fasting insulin levels, this test overcomes the challenges associated with large variations in insulin and glucose measurements, which can fluctuate widely based on recent meals, stress, or circadian rhythms. Instead, lipoprotein measurements reflect longer-term metabolic health that are less prone to short-term variability.
Hemoglobin A1c Is A Weak Predictor of Future Cardiovascular Disease
Compared to insulin resistance measured by the LPIR Score, Hemoglobin A1c (HbA1c) is a weak predictor of cardiovascular disease, highlighting its limited utility in longevity medicine (Table 7). What explains this dramatic discrepancy? HbA1c is a measurement of long-term blood glucose control, not insulin resistance. While there is a strong degree of correlation between insulin resistance and blood glucose dysregulation, these are two distinct abnormalities (Figure 3). Early stages of insulin resistance cause an increase in the release of circulating insulin, known as hyperinsulinemia. This compensatory mechanism enables the body to maintain normal blood glucose values. Therefore, despite insulin resistance and hyperinsulinemia, the body can maintain a normal Hemoglobin A1c and CGM data. Importantly, Insulin Resistance, with or without blood glucose dysregulation contributes to the risk of premature death, frailty, cardiovascular disease, certain cancers, dementia, infertility, and many other undesirable illnesses.5-11
Because HgA1c and CGM are measurements of blood glucose control, they rely upon abnormalities in blood glucose to suggest the possibility of insulin resistance. Once again, however, abnormalities in blood glucose control are not a requirement of insulin resistance. Thus, the reliance on HbA1c and CGM for the detection of abnormalities in blood glucose control often enable early stages of insulin resistance to go undetected for years or decades. Meanwhile, insulin resistance is a significant risk factor of cardiovascular disease and contributes to damage of our blood vessels and exacerbates the atherogenicity of LDL and other ApoB-containing lipoproteins.32-34 Therefore, it is desirable to utilize testing strategies that identify and detect insulin resistance prior to the onset of blood glucose dysregulation or elevations in HbA1c or CGM data.
Table 7. LPIR Score and Hemoglobin A1c as Risk Factors of Cardiovascular Disease1
| Risk Factor, per SD Increment | Cardiovascular Disease Age of Onset < 55 Years Adjusted Hazard Ratio | Cardiovascular Disease Age of Onset 65 – 75 Years Adjusted Hazard Ratio |
| Insulin Resistance, LPIR Score | 6.40 | 2.09 |
| Hemoglobin A1c | 1.38 | 1.24 |
Figure 3. Stages of Insulin Resistance
Abbreviations: Continuous Glucose Monitor (CGM), Hemoglobin A1c (HbA1c), Lipoprotein Insulin Resistance Score (LPIR). Note: Reduced levels of insulin can be observed in late stages of insulin resistance as a result of pancreatic β-cell dysfunction.
Part 2. The Inadequacy of Hemoglobin A1c
Hormonal abnormalities in the body are typically diagnosed, monitored, and managed through the measurement of relevant hormone levels. For example, hypothyroidism and hyperthyroidism are primarily assessed by measuring thyroid-stimulating hormone (TSH), hyperparathyroidism relies on evaluating parathyroid hormone (PTH), while adrenal insufficiency (Addison’s disease) is diagnosed and managed by measuring cortisol levels. In contrast, the diagnosis and management of diabetes primarily relies upon blood glucose abnormalities rather than directly measuring insulin levels or insulin resistance. Importantly, blood glucose is not a hormone, and blood glucose dysregulation is not the fundamental abnormality relating to insulin resistance or type 2 diabetes.
The reliance on blood glucose measurements for the management and diagnosis of diabetes and insulin resistance stems from the historical sequence of events regarding the availability and development of diagnostic testing and medical understanding. Specifically, blood glucose testing was available decades before researchers understood insulin resistance or developed the ability to measure insulin levels directly. This outdated focus on blood glucose measurement has had significant implications and shortcomings. The two most significant limitations include the failure to reduce cardiovascular disease with improvements in blood glucose control, and the limited sensitivity of HbA1c to detect insulin resistance.
Improvements In Hemoglobin A1c Do Not Reliably Reduce Cardiovascular Disease
In the Action to Control Cardiovascular Risk in Diabetes (ACCORD) trial, more than 10,000 participants with type 2 diabetes and elevated cardiovascular risk were randomized to receive either intensive blood glucose control (target HbA1c < 6.0%) or standard control (HbA1c targets of 7.0% to 7.9%).35 The trial aimed to evaluate the impact of strict blood glucose control and cardiovascular disease over a 5.6-year period. However, the intensive glycemic control arm was halted early at 3.5 years due to an unexpected increase in all-cause mortality within this group. Furthermore, intensive glucose control did not lead to a significant reduction in cardiovascular disease. In summary, strict blood glucose control resulted in higher rates of complications, reduced average lifespan, and failed to decrease the incidence of cardiovascular disease.
Subsequent randomized trials, including the ADVANCE trial and the Veterans Affairs Diabetes Trial (VADT), again investigated the impact of strict blood glucose control on cardiovascular outcomes.36,37 Both trials again demonstrated that intensive glycemic control did not reduce the risk of cardiovascular disease or improve survival. At best, reductions in microvascular complications were achieved, including outcomes relating to kidney dysfunction (nephropathy), eye disease (retinopathy), and nerve damage (peripheral neuropathy). However, these trials failed to achieve reductions in cardiovascular disease or improvements in lifespan.
Collectively, these findings call into question the utility of blood glucose control as a biomarker for promoting longevity and reducing cardiovascular disease. Moreover, as we will explore, measurements of blood glucose control are not optimal tests for detecting the early stages of insulin resistance. Therefore, it is reasonable to prioritize testing strategies that more directly assess insulin resistance rather than blood glucose control (Table 9).
Hemoglobin A1c Is Not An Optimal Test For Detecting Insulin Resistance
As previously discussed, Hemoglobin A1c (HbA1c) is not an optimal test for identifying insulin resistance. While HbA1c reflects long-term blood glucose control, it lacks the sensitivity of other available methods for detecting insulin resistance, particularly in its early stages (Table 9). This limitation of HbA1c is demonstrated in a study that evaluated more than 850 adults, where researchers compared the effectiveness of various tests for identifying insulin resistance.2 Using the American Diabetes Association’s (ADA) “pre-diabetes” HbA1c range of 5.7% to 6.4%, only 23.6% of individuals with confirmed insulin resistance were accurately identified by measurement of HbA1c. In contrast, Impaired Fasting Glucose (IFG) identified 69.1% of these individuals, and the Impaired 2-Hour Glucose Tolerance Test identified 59.5%.
Aside from its limited ability to detect insulin resistance, HbA1c can be elevated in healthy individuals who do not have insulin resistance. For example, endurance athletes may have elevated HbA1c due to higher fasting glucose levels. Other factors, such as a prolonged red blood cell lifespan, certain medications, and benign physiological variations, can also result in elevated HbA1c. These factors underscore the need to prioritize tests that more directly assess insulin resistance, regardless of whether HbA1c levels are elevated or normal.
Lipoprotein Insulin Resistance Score (LPIR)
The Lipoprotein Insulin Resistance Score (LPIR Score) is a useful test to assess for insulin resistance, especially in those with a normal body weight and normal blood glucose control.3,4 This test analyzes changes in lipoprotein particle size and concentration to determine the presence and severity of insulin resistance. Unlike HbA1c, the LPIR Score provides a direct assessment of metabolic dysfunction associated with insulin resistance.
Triglyceride-Glucose Index (TyG Index)
The Triglyceride-Glucose Index (TyG Index) is another useful and practical test for detecting insulin resistance. This index is calculated using a simple mathematical formula that combines fasting triglyceride and fasting glucose levels, making it both cost-effective and accessible.38 Research has demonstrated the TyG Index to be a superior predictor of insulin resistance compared to HbA1c.38 Beyond insulin resistance, the TyG Index is strongly associated with lifespan (all-cause mortality), frailty, multiple types of cancer including breast and colon cancer, and dementia.5-11
Homeostasis Model Assessment of Insulin Resistance (HOMA-IR)
The Homeostasis Model Assessment of Insulin Resistance (HOMA-IR) is another widely used method to assess for insulin resistance by measuring fasting glucose and fasting insulin levels. While HOMA-IR is highly sensitive, it is less reliable than the LPIR Score and TyG Index due to its susceptibility to large day-to-day fluctuations in fasting insulin and glucose levels.12-14 These fluctuations may occur for reasons unrelated to insulin resistance, such as stress, recent dietary changes, or acute illness, which can lead to inconsistent HOMA-IR values. As a result, HOMA-IR should be interpreted in conjunction with other testing strategies when evaluating insulin resistance.
Table 8. Early and Accurate Identification of Insulin Resistance
| No Insulin Resistance | Elevated Glucose Likely Due to Reasons Other Insulin Resistance | Early Insulin Resistance | Early to Advanced Insulin Resistance +/- Diabetes |
| Normal HbA1c | Slightly Elevated HbA1c | Normal HbA1c | Abnormal HbA1c |
| Normal LPIR Score, TyG Index, and HOMA-IR | Normal LPIR Score, TyG Index, and HOMA-IR | Abnormal LPIR Score, TyG Index, and/or HOMA-IR | Abnormal LPIR Score, TyG Index, and/or HOMA-IR |
Table 9. Comparison of Tests Evaluating Insulin Resistance
| Description | Strengths | Limitations | |
| LPIR Score (Link) | Advanced lipoprotein analysis used to quantify insulin resistance. | Highly sensitive test; identifies insulin resistance among those with and without blood glucose dysregulation; does not rely on fasting glucose or insulin, avoiding variability due to external factors. | Limited awareness and utilization among healthcare professionals; only available at LabCorb. |
| Triglyceride-Glucose Index (Link) | Freely available calculation derived from fasting triglyceride and fasting blood glucose values. | Sensitive test capable of identifying insulin resistance with commonly available test results. | Fasting triglycerides and glucose can fluctuate due to external factors such as acute stress, infection, or recent dietary intake. |
| HOMA-IR (Link) | Freely available calculation derived from fasting insulin and fasting blood glucose. | Sensitive and specific test for identifying insulin resistance. | Requires fasting insulin measurement, which can vary daily due to stress, circadian rhythms, and other non-metabolic factors. |
| Oral Glucose Tolerance Test (OGTT) | Measures glucose and insulin levels at timed intervals after a glucose load (75 g). | Directly evaluates the body’s response to a standardized glucose challenge. | Time-consuming (2-3 hours); fasting required. |
| Hemoglobin A1c (HbA1c) | Measures average blood glucose levels over the past 2-3 months. | Offers long-term insight into blood glucose control; does not require fasting; useful for monitoring advanced stages of diabetes. | Not a direct measure of insulin resistance; influenced by conditions like anemia or altered red blood cell turnover, and factors unrelated to glucose metabolism. |
| Continuous Glucose Monitor (CGM) | Measures real-time glucose levels over days/weeks, capturing fasting, post-meal, and daily glucose variations. | Provides dynamic feedback on glucose trends in relation to food intake, physical activity, and lifestyle. | Does not directly measure insulin resistance; results can vary significantly; primarily designed for diabetes management. |
| Triglyceride:HDL Ratio | A simple ratio of fasting triglycerides to HDL cholesterol. | Easy to calculate; inexpensive; useful for screening for metabolic syndrome and risk of insulin resistance. | An indirect marker of insulin resistance; influenced by factors like dietary habits, physical fitness, and non-metabolic lipid changes. |
Part 3. Continuous Glucose Monitors Lack Precision and Reproducibility
Continuous Glucose Monitors (CGMs) have attracted a growing amount of attention due to their ability to provide real-time feedback regarding blood glucose levels, especially for individuals with Type 1 and Type 2 Diabetes. These devices offer several novel advantages, including convenience, ease of use, and the ability to track blood glucose fluctuations throughout the day in response to food intake, physical exercise, and other lifestyle factors. As a result, CGMs have gained popularity among health conscious individuals seeking to optimize their health, even among those without diabetes. However, despite their growing use, the effectiveness of CGMs in individuals without diabetes remains unclear.
For individuals without diabetes, it is important to recognize that glucose spikes following food intake is normal and does not necessarily indicate insulin resistance. In healthy individuals without diabetes, there is no consensus on “optimal” glucose ranges for healthy individuals, which can lead to confusion or anxiety when values deviate from arbitrary goals. In healthy individuals, post-meal glucose levels of 140–150 mg/dL are typical and should not necessarily be viewed as a cause for concern. Therefore, while CGMs provide valuable insights into glucose dynamics, their interpretation may be misleading without a deeper understanding of normal physiological fluctuations. Furthermore, without corresponding data on insulin, triglycerides, and other markers of metabolic health, CGMs alone may not provide actionable insights unless clear patterns are observed, including frequent or unexpected spikes in glucose greater than 150 mg/dL.
To assess the reliability of CGMs in measuring post-meal blood sugar levels in adults without diabetes, researchers at the National Institutes of Health (NIH) analyzed data from 30 participants in a controlled inpatient setting.15 During this study, their blood sugar responses were tracked after duplicate meals were consumed one week apart. There were a total of four different dietary patterns assessed and two CGM devices were used, including the Abbott Freestyle Libre Pro and Dexcom G4 Platinum. The findings of this study demonstrated a high degree of variability and inconsistency in the blood sugar values obtained in response to identical meals spanning all dietary types. Specifically, the study found weak to moderate correlations between blood sugar responses to duplicate meals, with low reliability within individuals. Variability in responses to identical meals was similar to the variability observed with different meals. Collectively, these findings led the authors of the study to conclude that individual post-meal blood sugar responses to identical meals are highly variable and unreliable among those without diabetes. As a result, personalized dietary advice based on CGM measurements may be inconsistent.
The most practical application of CGMs is for individuals with insulin resistance, where real-time, individualized feedback can help identify foods that lead to prolonged or excessive glucose elevations. This information may guide dietary modifications, such as food avoidance, reducing portion sizes, or adjusting meal frequency. CGMs alone are insufficient for diagnosing insulin resistance and should be interpreted alongside other metabolic markers for a more comprehensive assessment.